Chris
posted this
08 December 2018
- Last edited 08 December 2018
My Friends,
I am no web developer, however, I do try to know a bit about it, even if I do fumble through it now and again.
F12 on your keyboard will give you developer Tools. You should see a "Performance" Tab. If you hit the Green Play button, and then refresh the page.
Once the page is fully loaded, give it a little longer, just to make sure, then hit the Red Stop button. Then analyse the data. Look for the HTTP Request: (/) - This is the initial request. It looks like this:
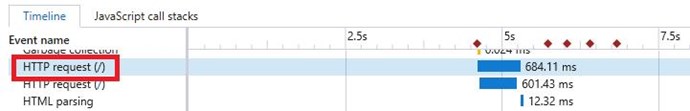
The time is around 4.5 seconds, where we refreshed the page. Now look at the page Paint, the last one, after the Layout and before the Garbage Collection. It will look something like this:
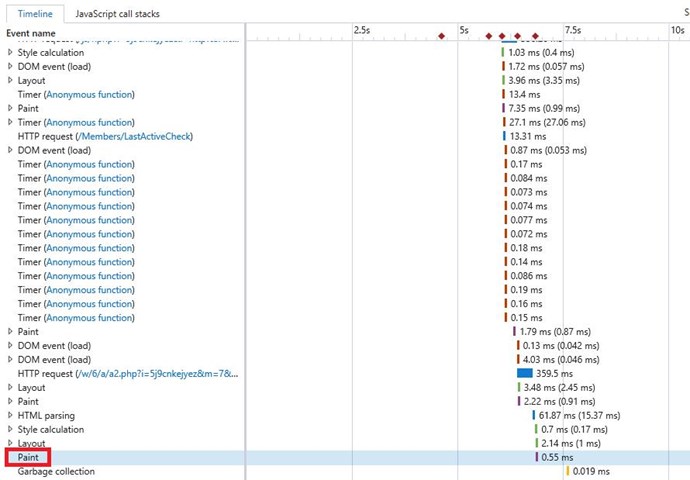
The time is around: 6.6 Seconds. So we have a page load time of approximately: 6.6 - 4.5 = 2.1 Seconds. The time will vary, it may be longer sometimes compared with others. But, please let me know, this is important to me.
Critically, we have fixed the Session Timeouts. I was getting so annoyed with that problem!
Please keep me updated on how this is going for you, on your end!
Chris
P.S: Prometheus or Zanzal may be able to provide an easier way to do this assessment of Page Load Time.